
Incentive cost modelling
As many of our audience will be familiar with, benchmarking pay levels is most commonly conducted on a role-by-role basis. This can be helpful in indicating pay competitiveness at the individual level but tells us nothing about the aggregate pay costs across all staff. Whilst some financial services companies habitually consider overall remuneration funding rates (e.g. Schroders sets a compensation-to-revenue ratio to guide its remuneration decision making), the use of such guidelines/targets is rare in other sectors.
The Ellason team is often asked how much remuneration should cost. To answer this question, we have built a model to gauge actual remuneration funding rates, using a combination of data sources and capturing annual data for all companies in the FTSE350 and Small Cap over the last six years.
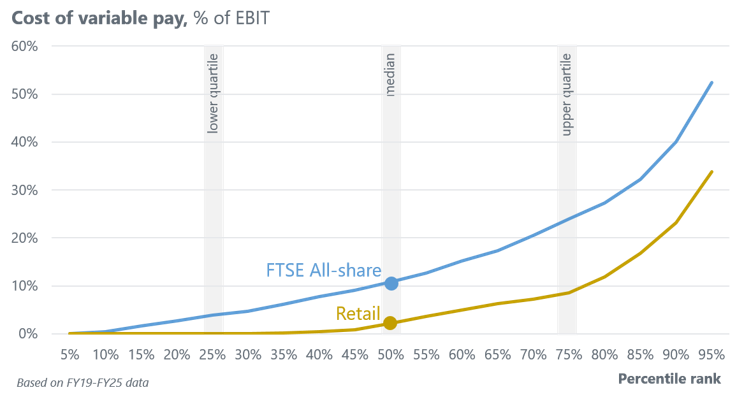
As an example of the model’s output, it suggests the median funding rate across the entire FTSE for all variable pay is 11% of EBIT (e.g. if pre-variable pay EBIT is £100m, then £11m would be used to fund the bonus and long-term incentives). However, the 11% average across the entire FTSE masks some significant variation between business sectors, which we are able to use our model to help isolate. As an example, the chart below shows the typical funding rates in the retail sector; these are significantly lower than those modelled for the wider FTSE more generally.
Our model also provides different cuts of employment costs and financial metrics. For example, typically 19% of revenue is used by FTSE companies to fund the cost of the entire payroll, again with some large variation by business sector.
If you would like to learn more about how the Ellason model can help you gauge the market-suitability of your company’s remuneration structure, then please contact any of the Ellason team.